Unlock the Answers Hiding in Your Operations DataYour Data Knows Why — If You Can Decode It.
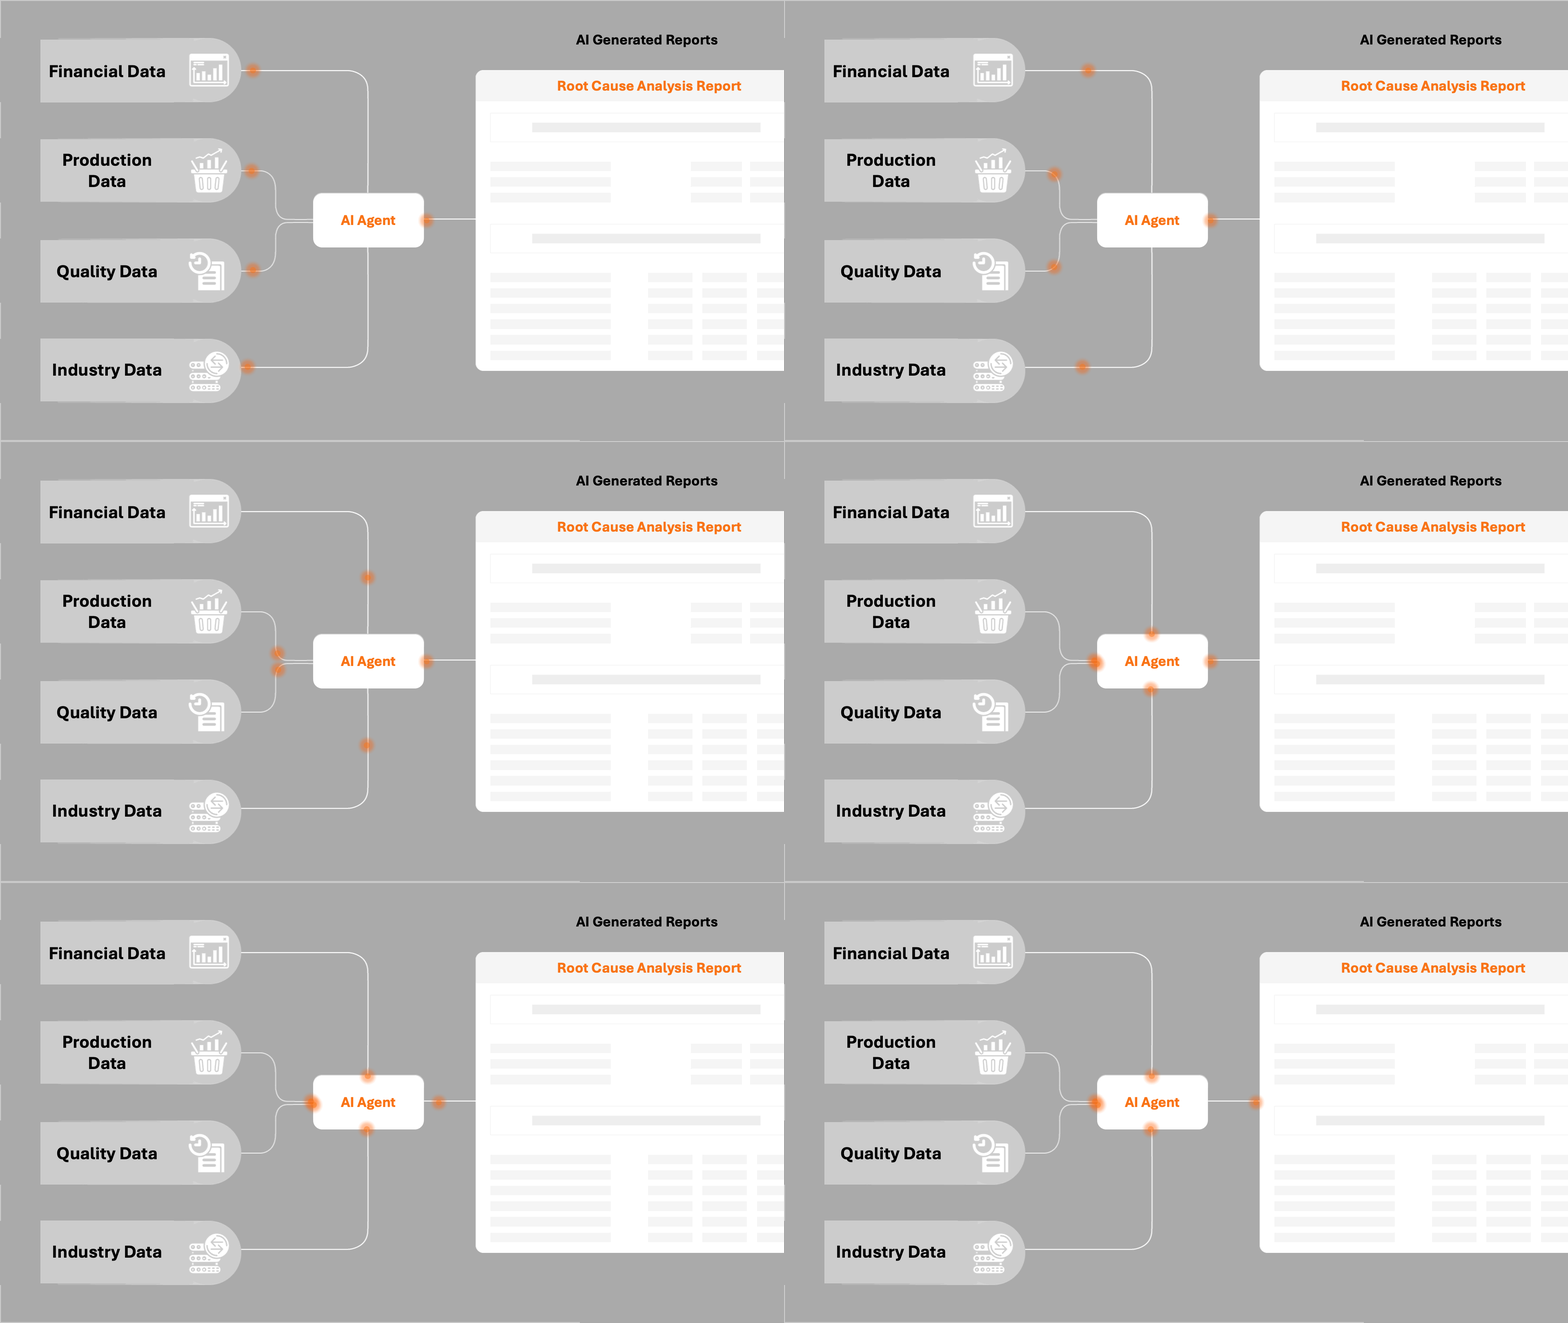
Factory teams are flooded with production data, quality logs, maintenance systems, and ERP exports — but can't answer why performance dips or downtime happens. Prodata connects the dots and delivers detailed, root-cause reports automatically — no BI dashboard guesswork, no manual wrangling.

Real Root-Cause Reporting, Not Just Dashboards
Most tools give you KPIs. We give you explanations. Prodata's AI agent analyzes structured data across machines, lines, and shifts to generate detailed reports — explaining why performance changed, not just what changed.
Hours Back, Every Week
Manual Excel exports. Endless meetings. "Gut-feel" conclusions. Sound familiar? We automate anomaly detection, reporting, and shift-based comparisons so your engineers and supervisors focus on fixing problems — not formatting spreadsheets.
Works With Your Stack — And Your Reality
Whether your data sits in SAP, MES, quality systems, or SQL tables — we work with it directly. On-prem, hybrid, or cloud — Prodata plugs in securely and configures around your workflows, not the other way around.
What Sets Prodata Apart
Unlike AI tools that summarize dashboards or guess based on text, Prodata can handle multiple sources of real structured data: production logs, line-by-line output, temperature profiles, sensor traces, and more — generating detailed, multi-layered reports trusted by engineers and ops managers alike.
Other platforms show "green/red" charts. We show you why line 3 dropped yield by 7% last week, and what made it bounce back yesterday.